
The Shape of Smart Bets
Most people think in bell curves. Symmetric outcomes. Win some, lose some, everything evens out.
This is a mistake.
The best decisions in business, investing, and life don’t live on normal distributions. They live on skewed ones.
The Seven Shapes
Look at how outcomes can distribute:
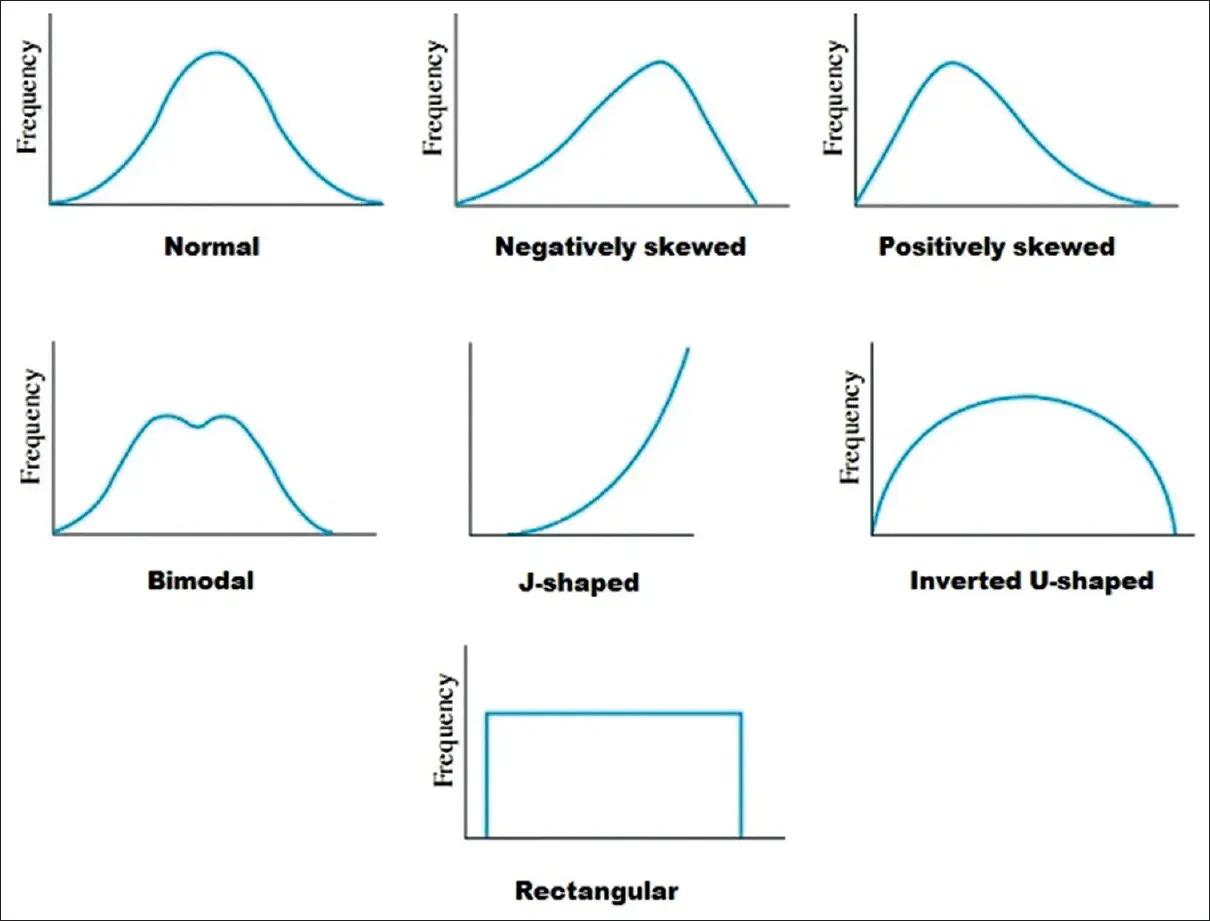
Normal: Equal chance of landing above or below average. The mean, median, and mode converge. Safe. Predictable. Also: boring.
Negatively skewed: Most outcomes are good, but the bad ones are catastrophic. Think: selling options, running a restaurant, being a landlord. You collect small wins until the tail event wipes you out.
Positively skewed: Most outcomes are mediocre or losses, but the wins are massive. Think: venture capital, writing a book, starting a company. You lose small and often, but when you win, you win big.
Bimodal: Two clusters of outcomes with little in between. You either succeed dramatically or fail. No muddy middle. Think: drug development, political campaigns, bold product pivots.
J-shaped: Low base rates, then explosive growth at the right tail. Most attempts yield nothing. A few yield everything. Think: content virality, network effects, compounding relationships.
Inverted U-shaped: Moderate inputs produce the best results. Too little fails. Too much fails. Think: caffeine and performance, stress and productivity, exercise volume and recovery.
Rectangular: All outcomes equally likely. Pure uncertainty. Rare in practice, but useful for modeling true ignorance.
Why This Matters
Here’s the uncomfortable truth: the shape of your payoff distribution matters more than your expected value.
Two bets can have identical expected values but completely different risk profiles.
Bet A: 50% chance of +$100, 50% chance of -$100. EV = $0.
Bet B: 99% chance of -$1, 1% chance of +$99. EV = $0.
Same expected value. Radically different games. Bet B is an asymmetric bet. You can make it 100 times, lose $99 on the failures, and one win makes you whole.
The Asymmetric Bet Framework
Asymmetric bets share three properties:
Capped downside. You know the worst case. You can survive it. Repeatedly.
Uncapped or disproportionate upside. The wins aren’t 2x. They’re 10x, 100x, or “changes the trajectory.”
Repeatability. You can take the bet multiple times. Each loss is tuition, not devastation.
This is the J-curve. This is positive skew. This is how step changes are built.
Where Symmetric Thinking Fails
Most corporate decision-making optimizes for the bell curve. Minimize variance. Avoid tail risks. Cluster around expected outcomes.
This works for operations. It’s death for strategy.
If you only make symmetric bets, you’re competing on execution in a world where execution is increasingly commoditized. You’ll be fine. You won’t be exceptional.
The firms and individuals who win disproportionately are hunting for positive skew. They’re comfortable with a high failure rate because they’ve structured their bets so failures don’t kill them.
The Practitioner’s Checklist
Before committing to any significant decision, ask:
What’s the shape of this payoff distribution?
Can I survive the downside? Multiple times?
Is the upside capped or open-ended?
How many times can I take this bet?
Am I thinking in expected value or in payoff shape?
If the downside is survivable, the upside is uncapped, and you can iterate, you’ve found an asymmetric bet. Take it.
If the downside is catastrophic or the upside is capped, you’re playing the wrong game.
The Meta-Lesson
The distribution shapes in a statistics textbook aren’t academic. They’re a lens for seeing the world clearly.
Train yourself to ask: what shape is this?
Then go find the J-curves.