Source: AI 2040: Plan A, AI Futures Project, July 2026.
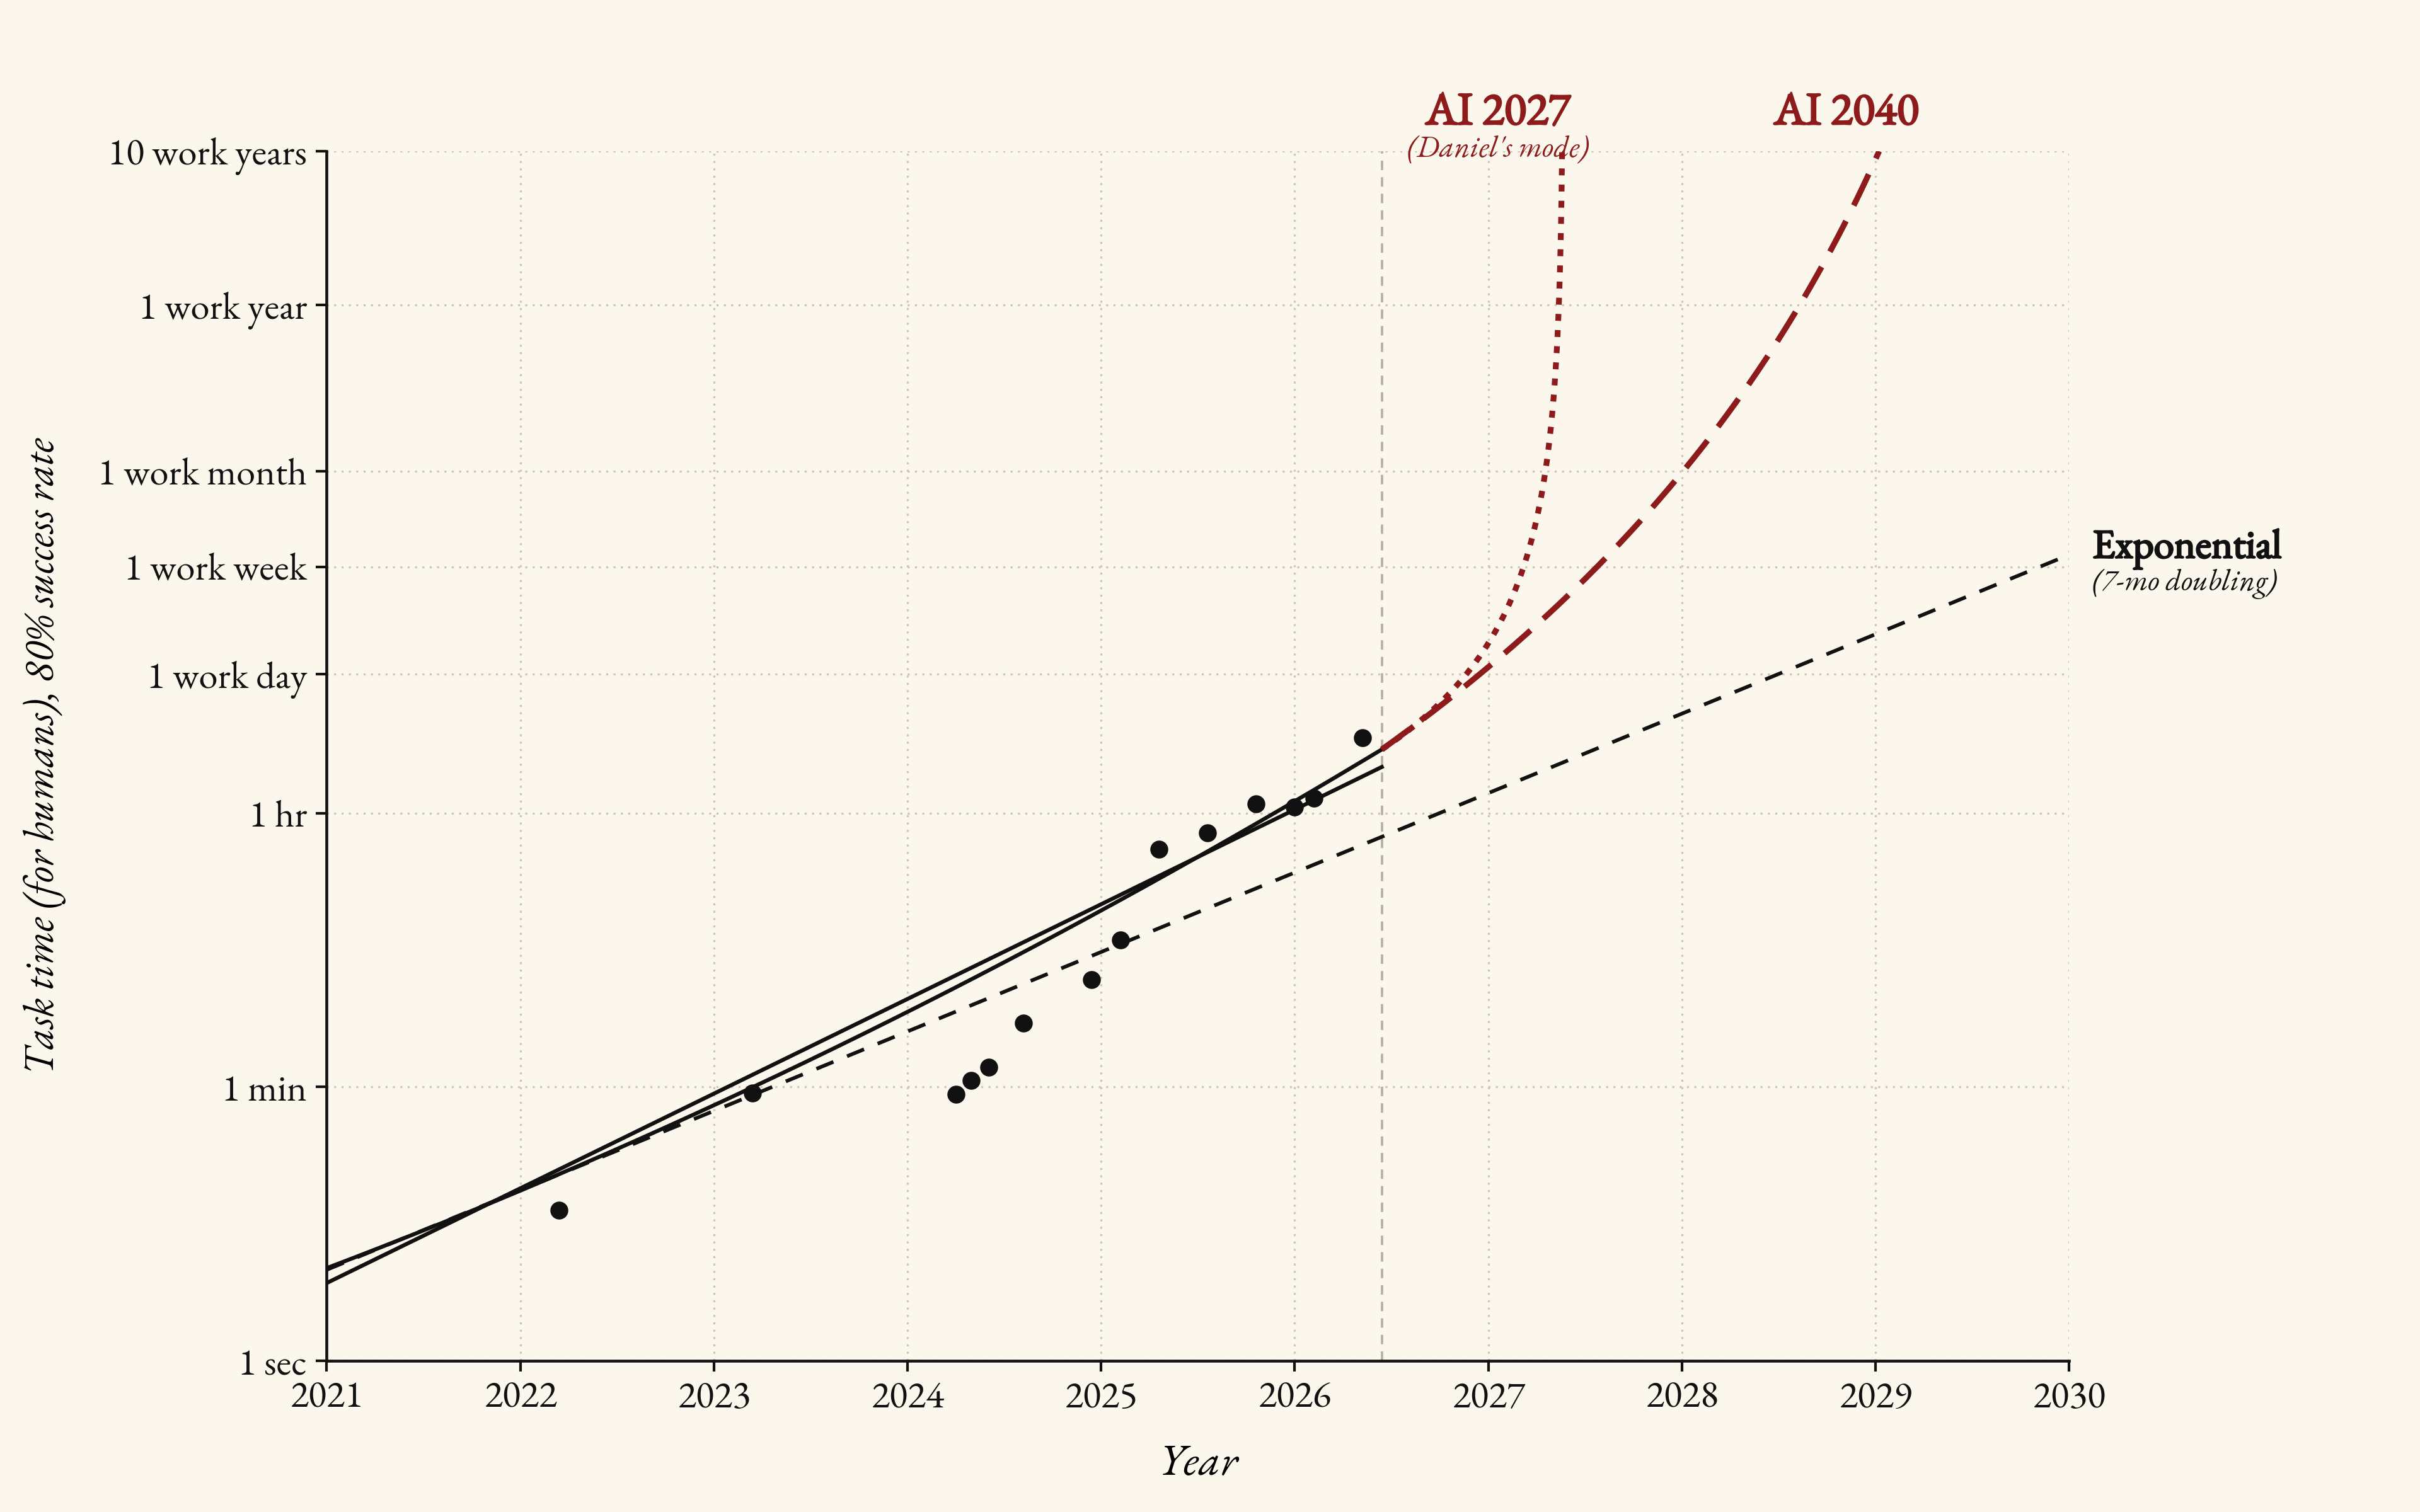
The AI Futures Project released AI 2040: Plan A this week. Superintelligence delayed to 2040 by a US-China deal, on the premise that without one, their model has AI research automating itself in 2030. One chart anchors the argument.
The dots are measurements. The curves are commitments. METR pays experts to complete software tasks, clocks them, then finds the task length AI handles at 80% reliability. That is a dot. The dots double on a schedule: seven months originally, closer to four lately. The red curves are not fits. Every line on the chart fits the data equally well; they only diverge after the dots end. The curves come from a model of AI accelerating its own research, and that model has a half-life. 2027 was Daniel Kokotajlo’s mode in 2025. The default is now 2030. Nobody revises a measurement because the mood shifted.
Read the axis. The viral version of this chart plots 50% reliability, where the frontier measures past sixteen hours. This one plots 80%, where the same model measures three. Reliability compresses the horizon five-fold, and the contracting bar sits higher still: 98%-plus before automation pays on reliability-critical work. Our deployments at Humanity Labs run 94%-plus across 160-plus production processes, and the engineering lives in those last four points. Capability prices the demo. Reliability prices the labor.
The chart measures legible work. Most work isn’t legible yet. METR’s tasks are self-contained and auto-gradable. The horizon approximates a low-context contractor, not an employee. A state had to make territory legible before it could tax it. A firm has to make work legible before AI can do it. Capability doubles twice a year. Legibility doesn’t. That is the binding constraint, and it is why the AI workforce business is a legibility business with a model inside.
The chart grades itself. The dotted AI 2027 curve needs dots visibly above trend by mid-2027 or it is dead. The AI 2040 path hugs the exponential through 2027 and gets its verdict in 2028. Mark the windows. Update on dots, not discourse.
The curves disagree about the date. They agree about the direction. Every line on the chart, the dull dashed one included, arrives at reliable AI horizons covering most well-specified knowledge work within a few years. The exponential takes the stairs. The superexponentials take the elevator shaft. None opens onto a world where this stalls.
So the move is identical under every curve. Make work legible. Deploy at contractual reliability. Let the doublings compound through you.
Every few months METR adds a dot. Watch where it lands against the dashed line. That delta tells you more than every red curve on the chart.
What’s your bet for how long your team at Humanity Labs will take to get to that 98% reliably? How much of it is the jumps the models must make?